List of contents:
- Introduction
- Signing up for Google Analytics
- Implementing the Tracking Code to FV Player
- Accessing the Statistical Data
- Video Errors
- Custom Reports
- Automatic Email Reports
- Tracking custom video ads
Introduction
Google Analytics is a great, free tool for tracking the performance of your website. It’s also a very useful platform for tracking the data about your videos.
We’ve developed a custom way of gathering data, which gives you a better view over the behavior of your audience.
You can now see how many times a video was played, if the viewer skipped a part of the video, or where he left off watching. In addition to that, you can go down to details such as the user’s platform, format or location, which is data necessary to adjust the videos for your audience.
To get all this, you need to follow only three simple steps:
- Sign up for an Analytics account with basic information about the site you want to monitor
- Paste the tracking code onto your webpage
- Monitor the data you want
This guide is for the older model of Universal Analytics. If you are using the new Google Analytics 4, click here .
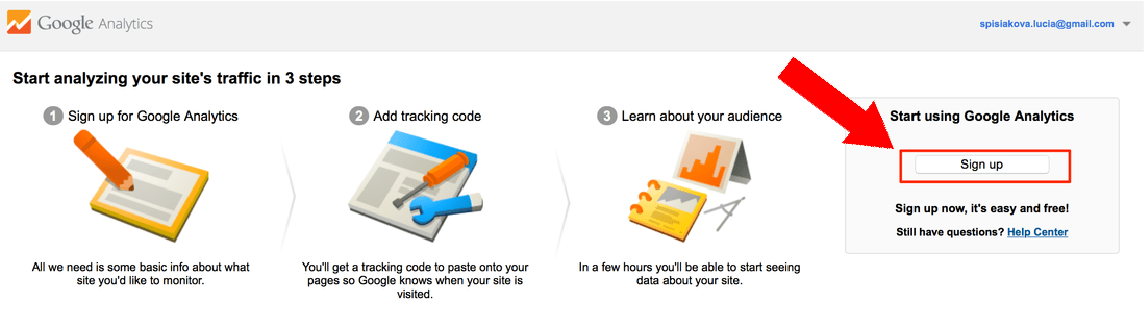
Signing up for Google Analytics
If you do not have an yet account, please sign up here. You will need a google account to do so.
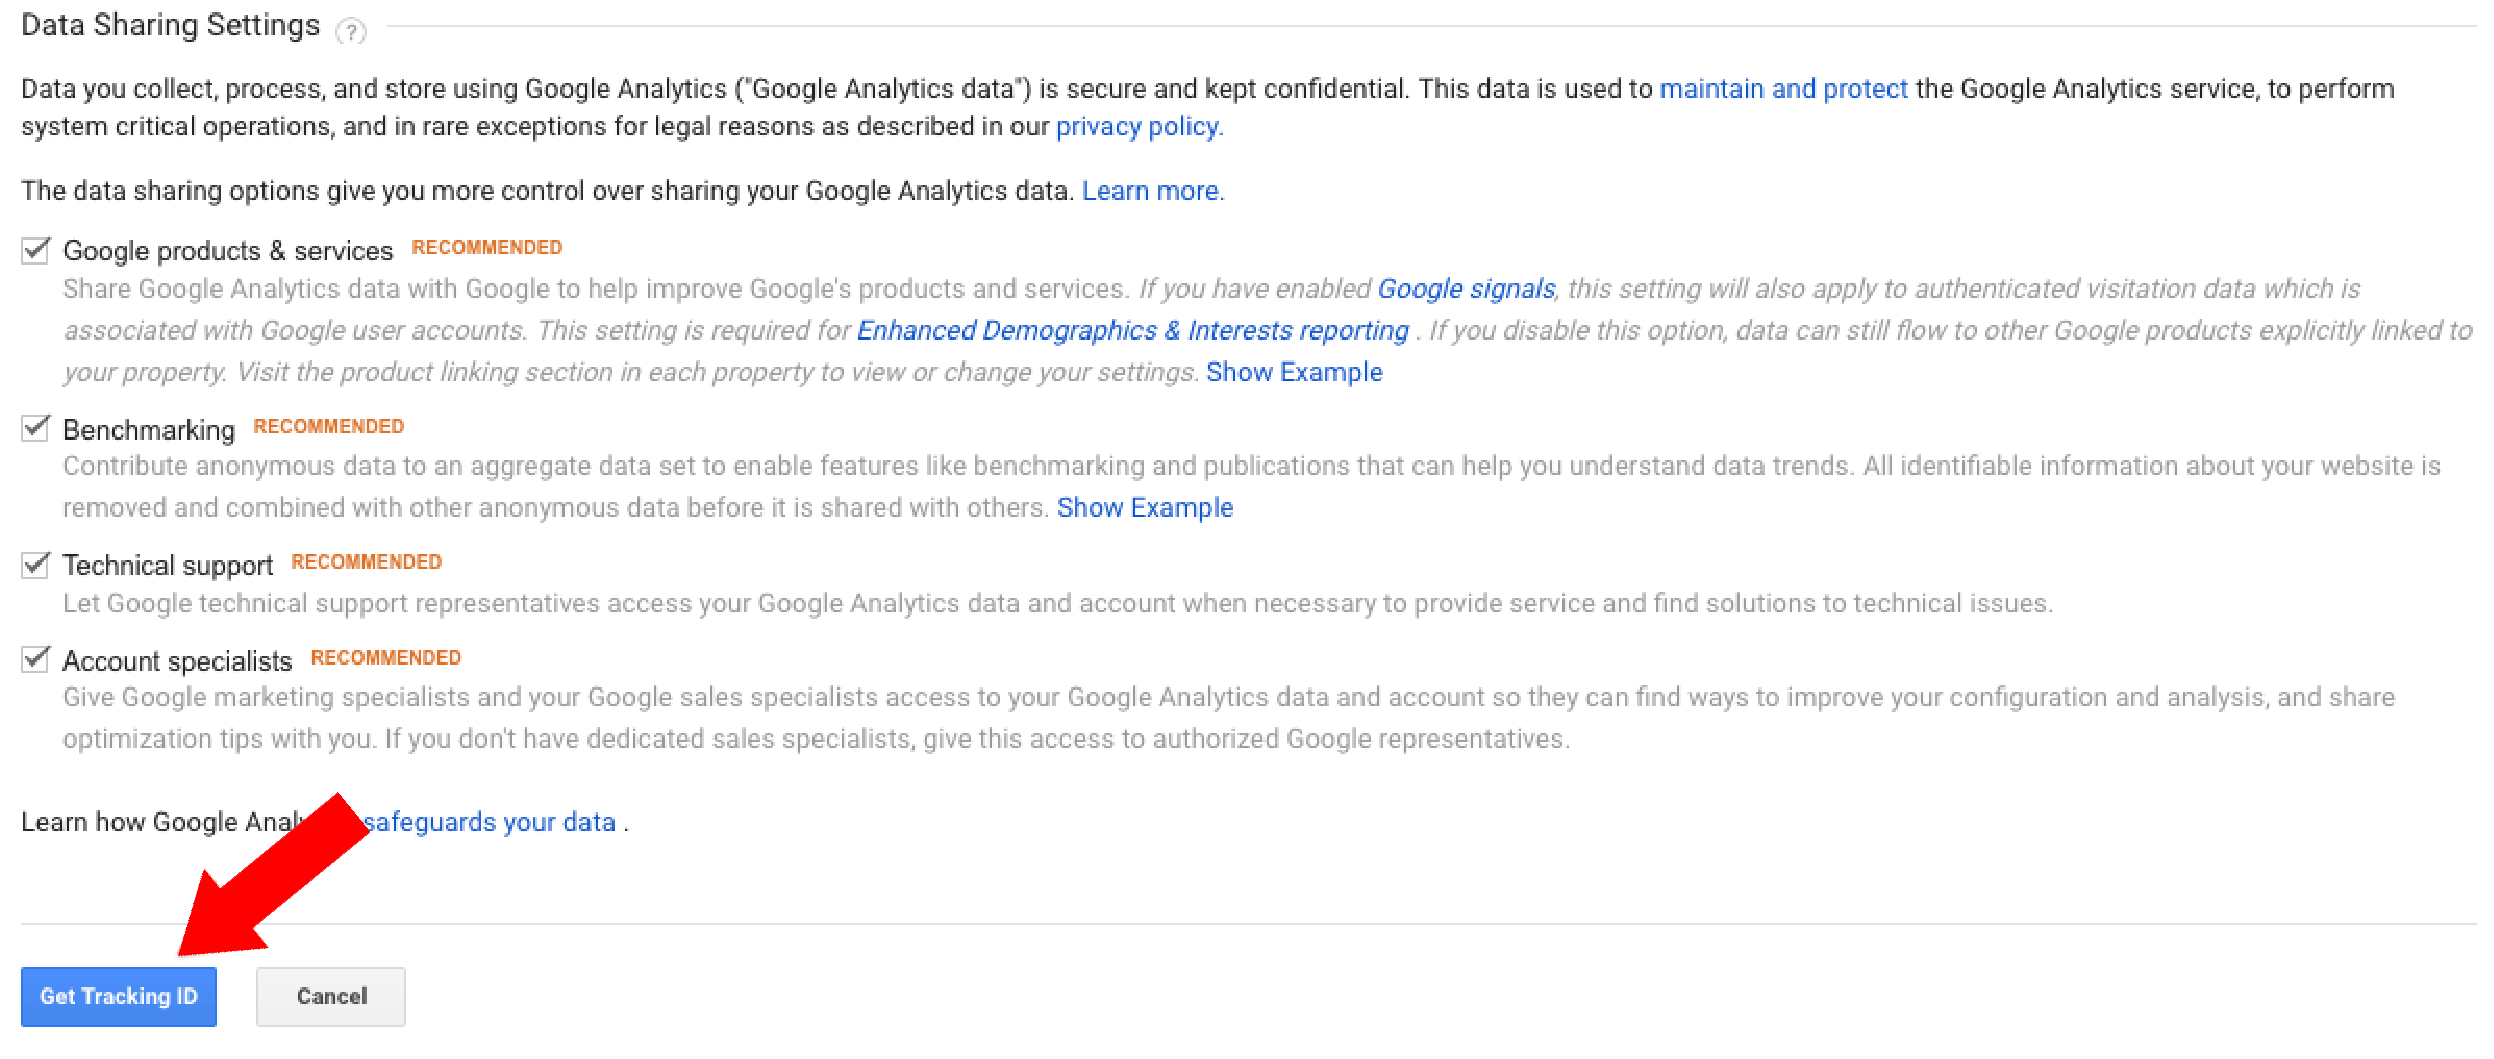
First fill in the form (all required fields). Then do not forget to adjust data sharing setting according to your preferences. In the end, click on Get Tracking ID.

Adjusting data sharing settings
Implementing the Tracking Code to FV Player
Copy your tracking ID. You can also find your tracking ID in your Google Analytics account at Admin tab > Tracking Info > Tracking Code and copy it.

Tracking ID in Google Analytics Admin tab
Inside your WodPress Admin panel, navigate to Settings > FV Player > Setup tab > Sitewide Flowplayer Defaults and paste the code into Google Analytics ID field. Click Save All Changes.

Google Analytics ID in the setup tab of FV Player

Accessing the Statistical Data
You can find the statistics for your videos under: Google Analytics > Behavior > Events > Top events
FV Player tracks information when a user is leaving a page. We track seconds played (repeats), format of video (Flash/ HTML 5) and video title or file name.
What do you get to see?
For example:
Views per video
What videos are popular on your site?
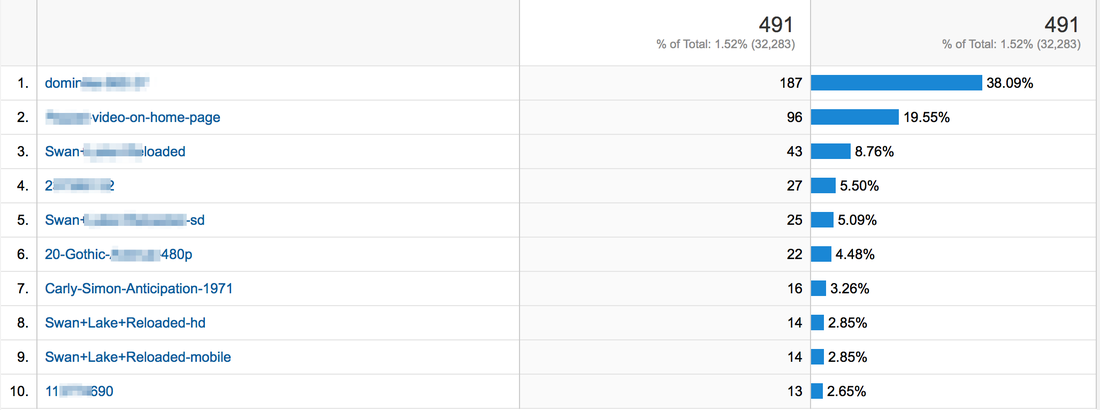
Where to find these statistics: in primary dimensions, click on Event Label. You can also sort these events by choosing a secondary dimension (click on Secondary Dimension and make your choice from the drop-down menu).
Video Quartiles
How many users started to watch a video and how many of them watched the full video?
First, check what videos are popular on your site by following the instruction above – What videos are popular on your site? (views per video).
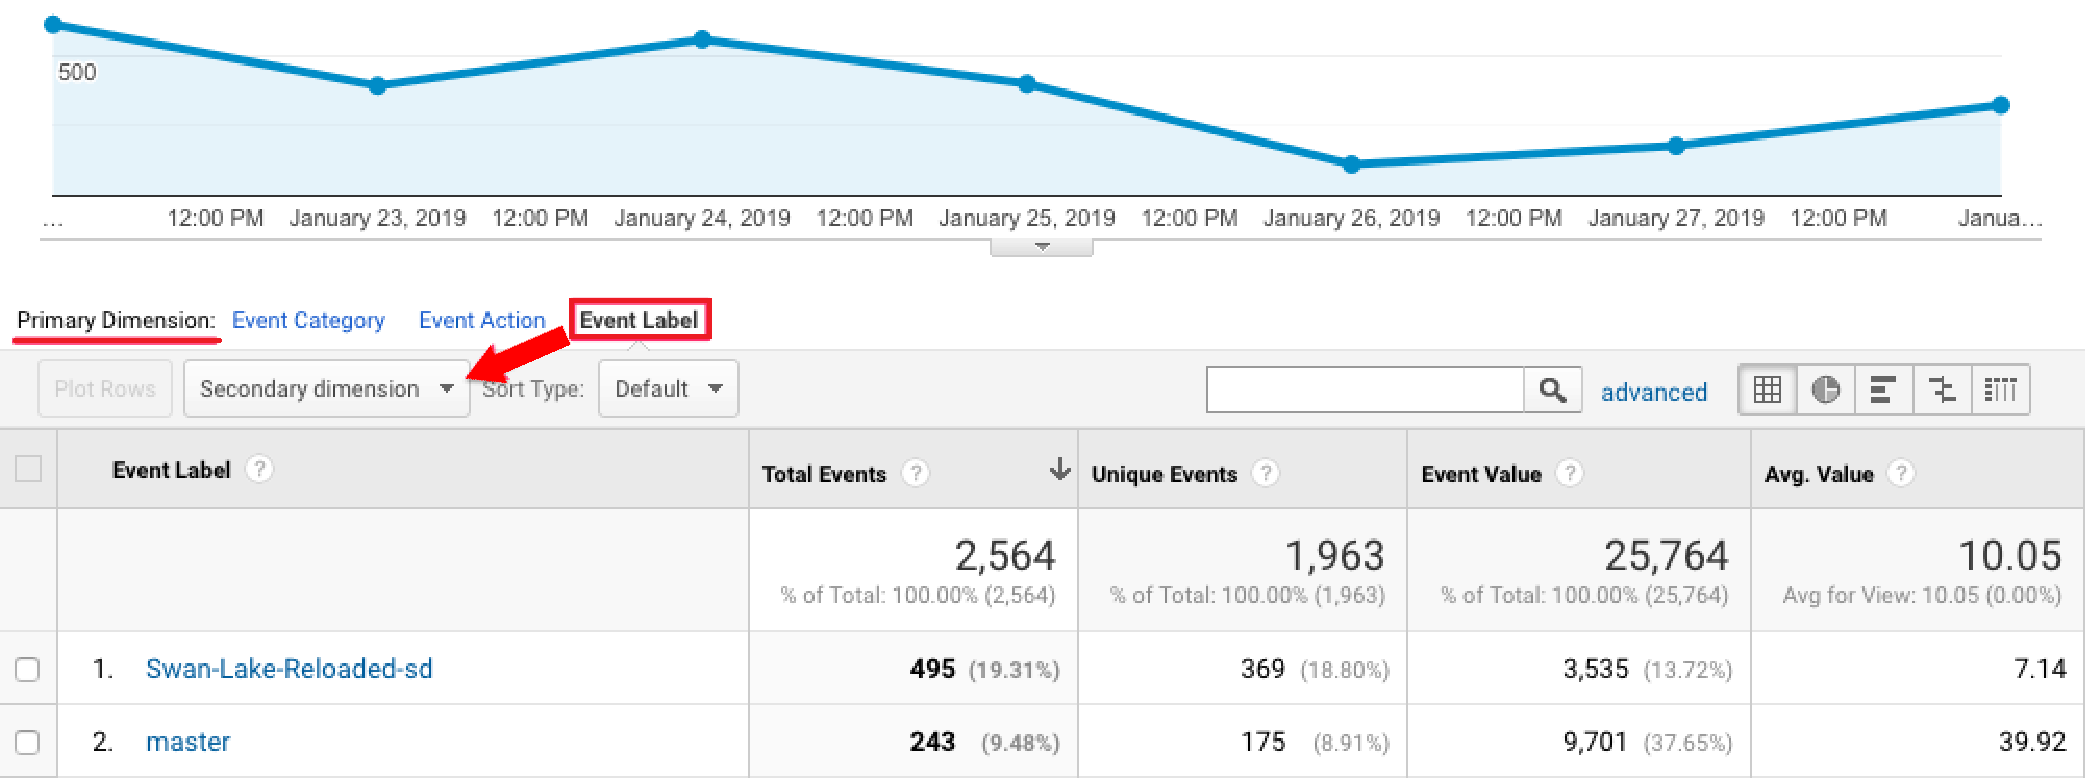
Then click any of the video names. It will open a new view, where you will see all the details. Click Primary Dimension > Event Category. You can switch to other videos by using All > Event Label at the top.

Check video events in detail
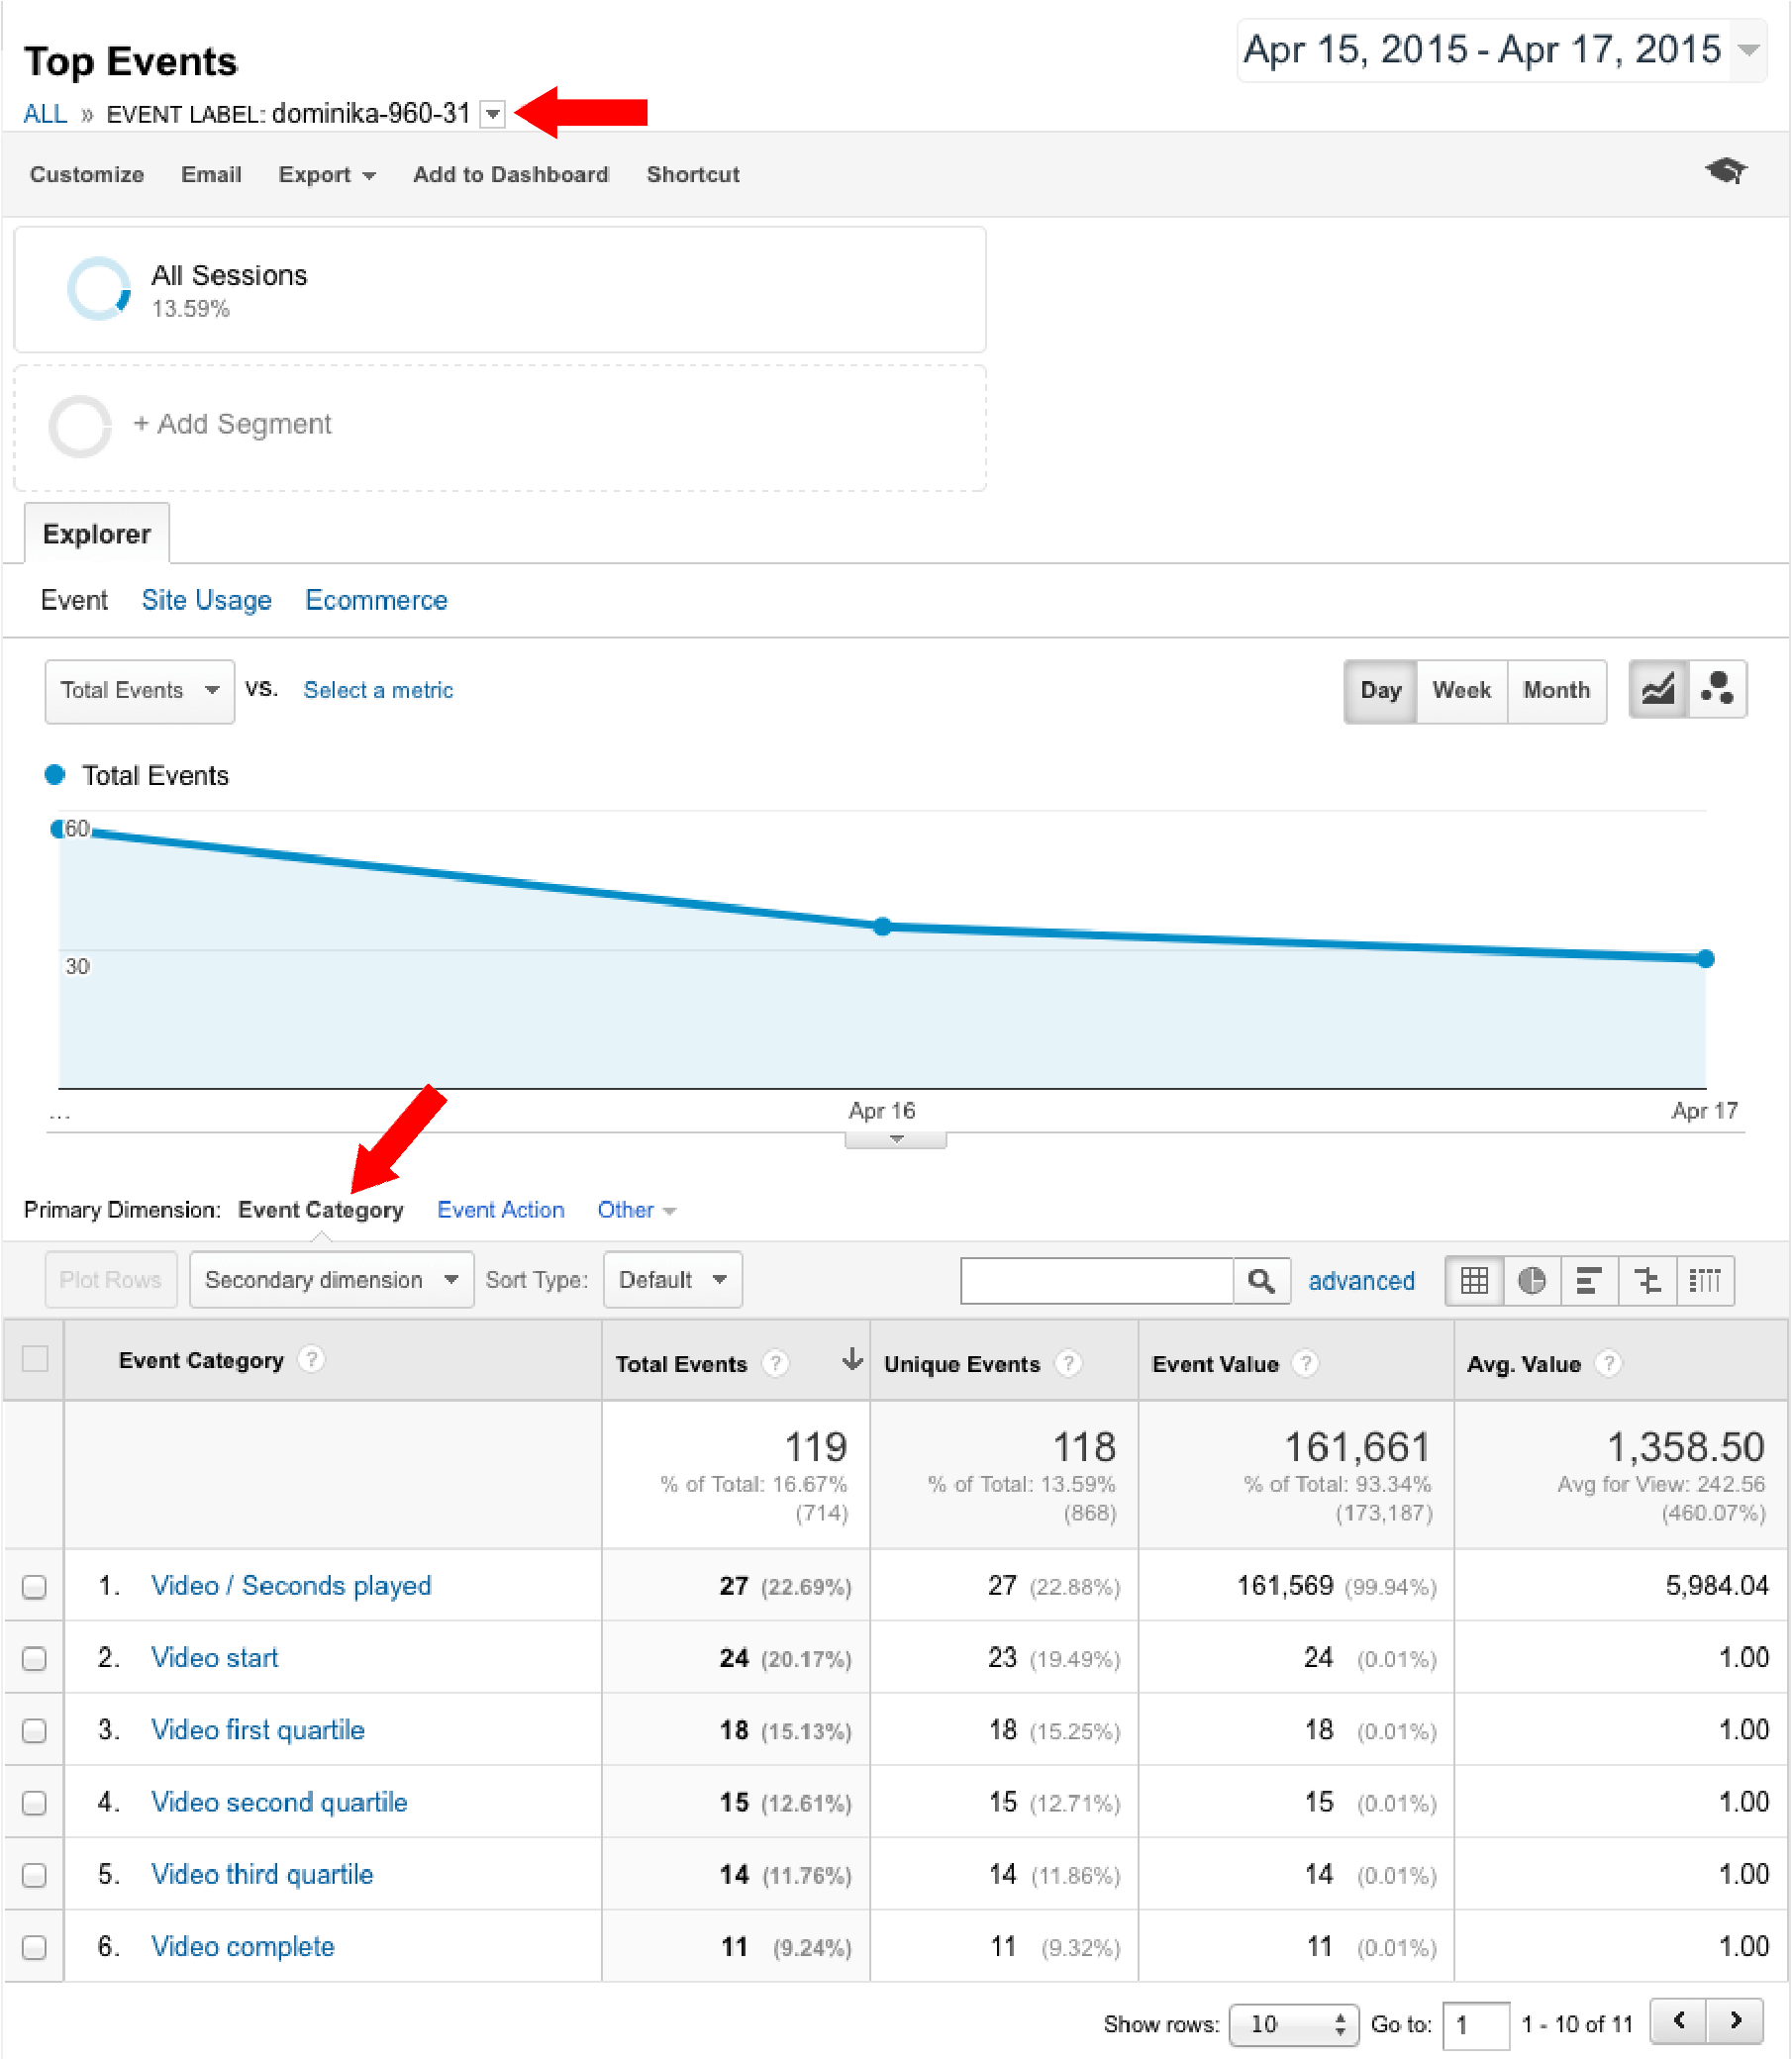
As you can see in the screenshot above, FV Player doesn’t show only the basic Flowplayer events, such as Video / Seconds played, but includes an extended list for more advanced tracking:
- Video start
- Video first quartile
- Video second quartile
- Video third quartile
- Video complete
The Video / Seconds played shows you the average number of seconds played. The events listed above show quartile sections of the video. The user might skip a part of the video right to the end, but that won’t count as Video complete event. That is counted only when all the quartiles are tracked, meaning the user has watched all parts of the video.
You can also track at which part the user stopped watching the video. The events are very similar to those in VAST/VPAID ad playback, about which you can learn more in this guide: Tracking VAST and VPAID Ads With Google Analytics
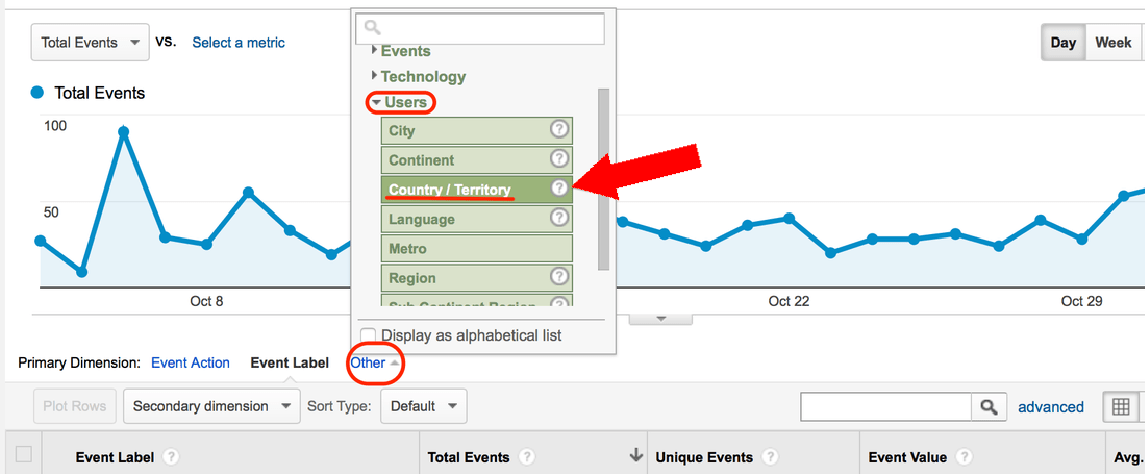
Geographical data
What country are your visitors/customers coming from?

Where to find these statistics: Click on Other when choosing a primary dimension for your analytics. From the drop-down menu choose Users > Country.
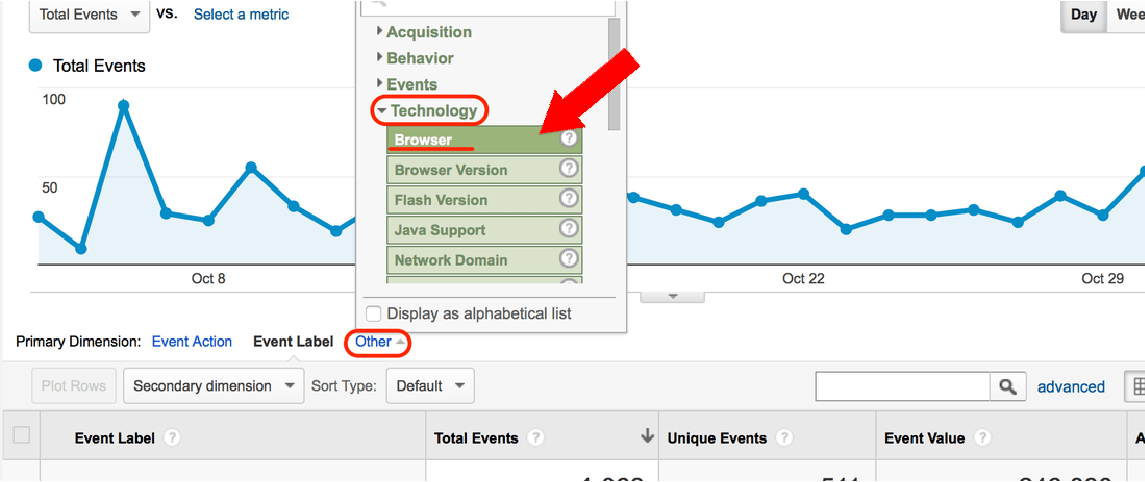
Browser data
What browser do your viewers use?
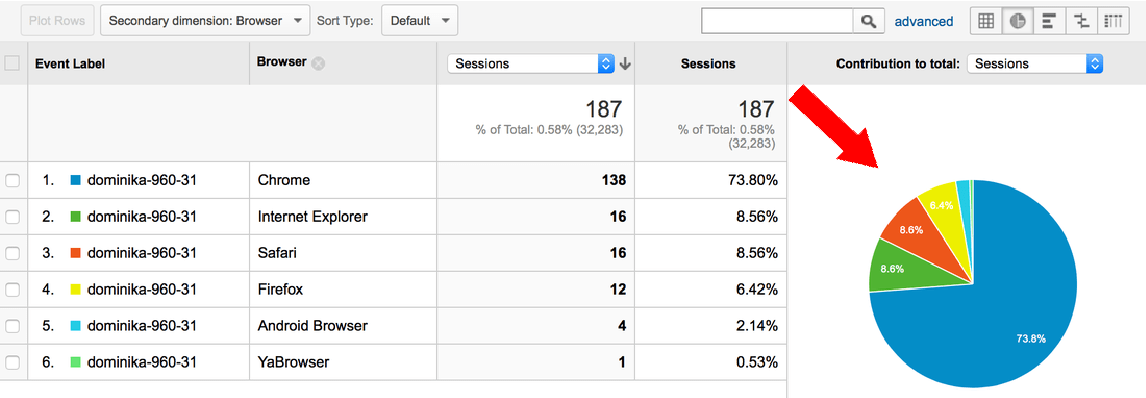
Where to find these statistics: Click on Other when choosing a primary dimension for sorting out data. Choose Technology > Browser from the drop-down menu.
And many many other important pieces of information: About technology your visitors use (Screen resolution, Java support, operating system…), what language they speak or whether they are first-time or returning visitors…
YouTube and Vimeo hosted videos
Can I view my stats for Youtube and Vimeo videos? Of course you can!
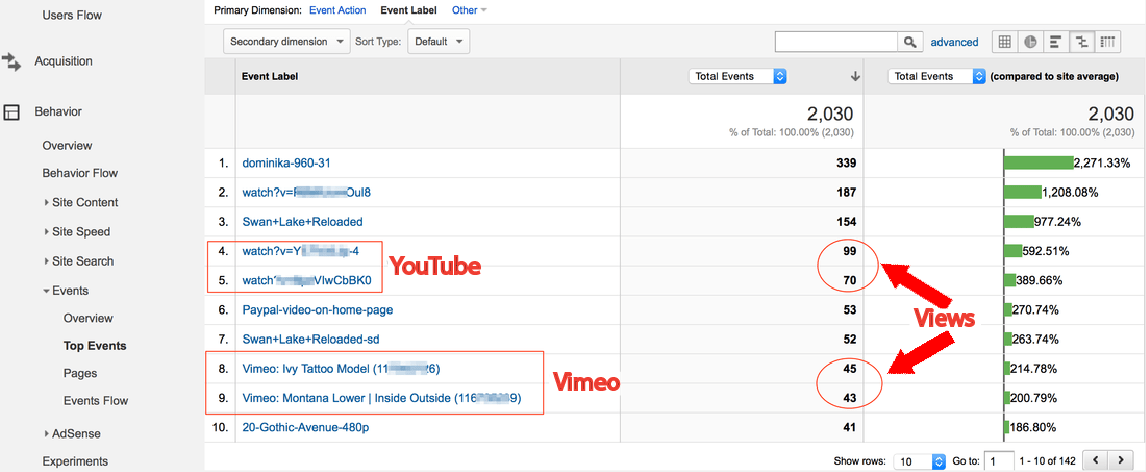
Where to find these stats: Behavior > Events > Top Events > Video / Seconds played. In the Primary Dimension tab choose Event Label. You can also choose how you want to display your data visually (data, percentage, performance, comparison, pivot).
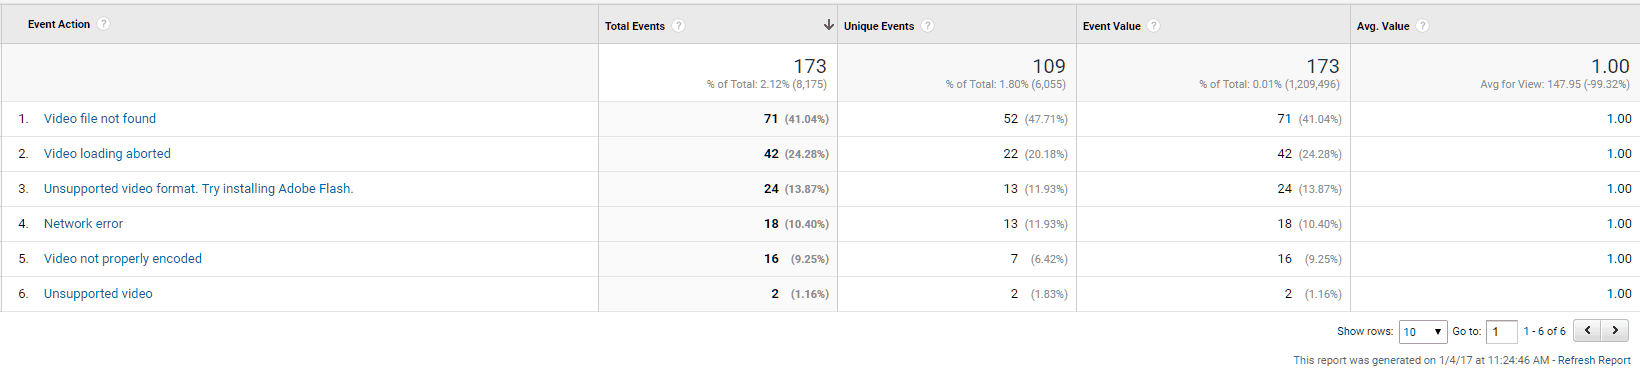
Video Errors
This data will help you track which videos failed to play, how many times, on what device, and more. To see these data, go to Behavior -> Events -> Top Events and choose Video error in the Event Category (as primary dimension). Open it and you will see the list of Event Actions (basically types of errors) ordered by frequency. Switching to Event Label will show you the names of the videos that failed to play.
However, there is more to that. You can also use these secondary dimensions for analyzing the errors on your website:
- Event Label – as mentioned, will sort the events by it’s label. In this case, it’s the name of the video file, which will give you the idea which particular video has failed to play
- Device Category – this will tell you on what type of device has the error occurred. There are three types: desktop, mobile and tablet
- Mobile Device Info – if you have problems with mobile devices, this dimension will show you the specific types of devices
- Operating System – this dimension will specify the operating system in which the error occurred
- Page – will show you the URL of the page, where the error event occurred
Alternatively, you can access the pages with most video plays via Behavior -> Events -> Pages. Pick a page you want to analyze, open the Video error event category and see what errors have occurred there.
Creating Custom Reports
Custom reports allow you to keep an close eye on any parameters of your choosing. In this example, we will set up a report to track the amount of seconds played.
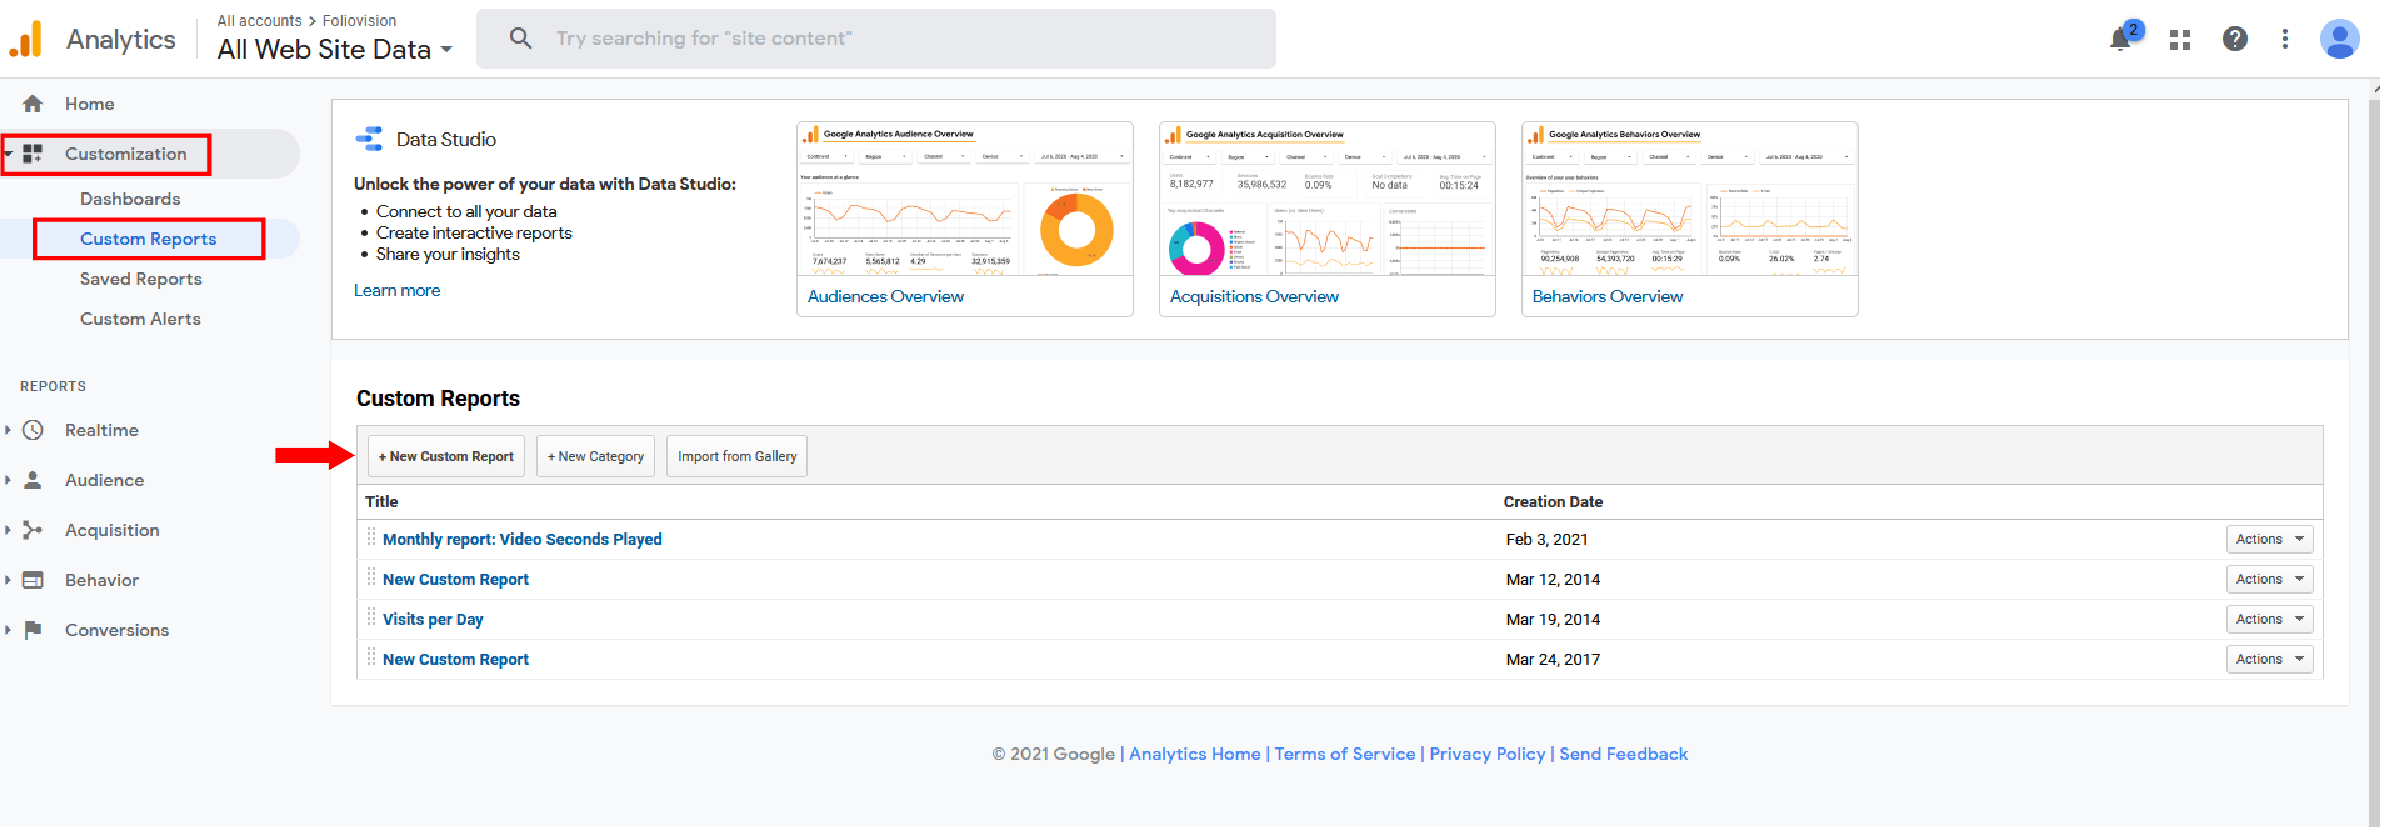
To set up a custom report, go to Customization -> Custom Reports in your Universal Analytics dashborad, and click “+New custom report“.

Creating a custom report
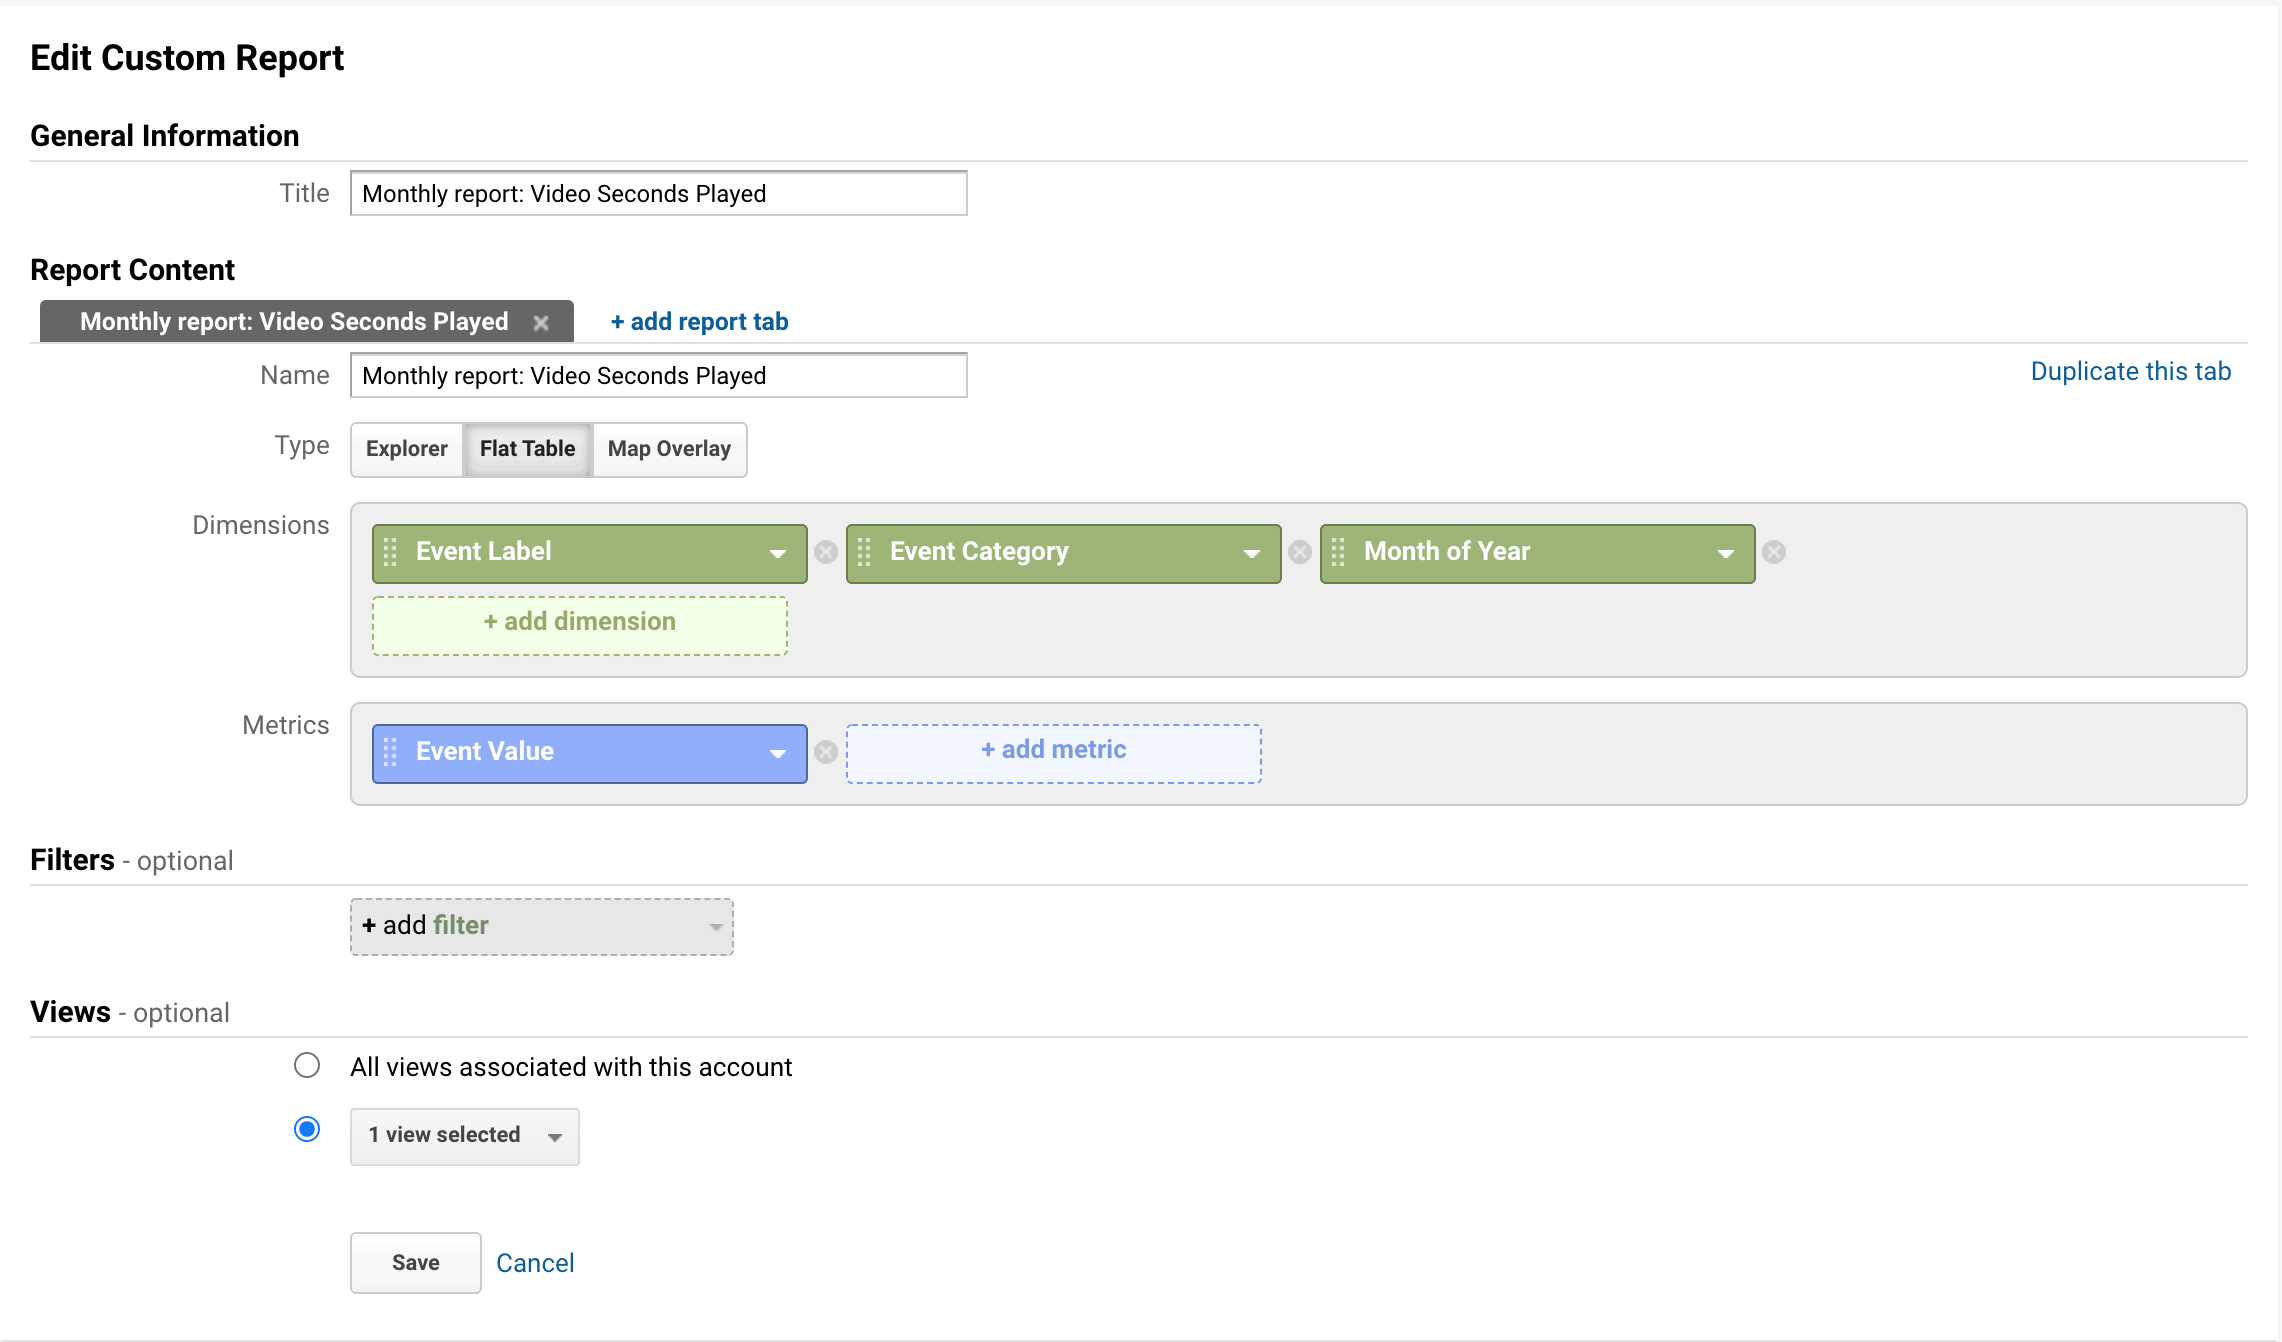
Title of the report is only for your information, so you can name it however you like. As the name of the reporting tab, put “Monthly report: Video Seconds Played“.
In the Metrics field, add Event Value from the drop-down menu. In Dimensions, add Event Label, Event Category and Month of Year.
Note: If you would like to track the average number of seconds played instead of the total number, you can put Average Value in metrics instead of the Event Value.

Custom report setup
Review and click save.
This is what your report should look like:

Video seconds played custom report

You can access your custom report in the Custom Reports screen of your GA dashboard and edit it anytime, by opening it an clicking edit.
Automatic Email Reports
You can set up automatic reporting for the parameters you are interested in seeing and have them sent to your email. This will help you track down any errors in your videos. This is one possible setup: go to Behavior -> Top Events and open the Video error category from the list of Event Categories. Set the Secondary Dimension to Page – now you can see what kind of error has occurred, how many times and on what page.
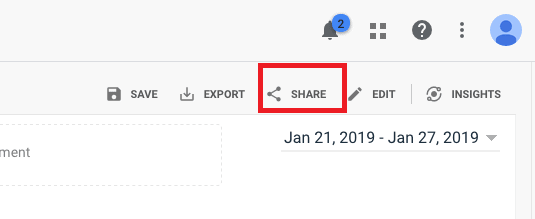
Now to set up the automatic reporting, hit the Share button in the top-right menu.
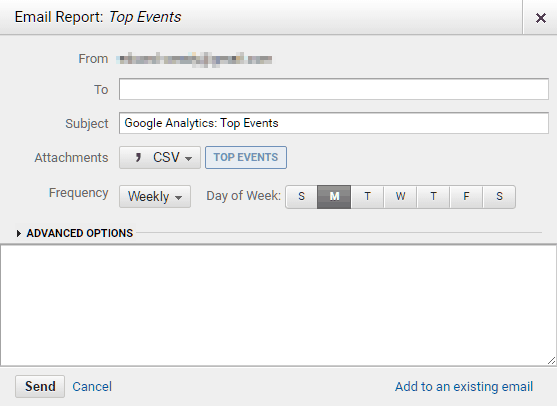
A new menu will appear. Here you can set the email to which all the reports will be sent, Edit the subject, set the format of the generated report and adjust the frequency of reports. If you want to get several reports in one email, you can create several set-ups and merge them into one using the Add to an existing email button.
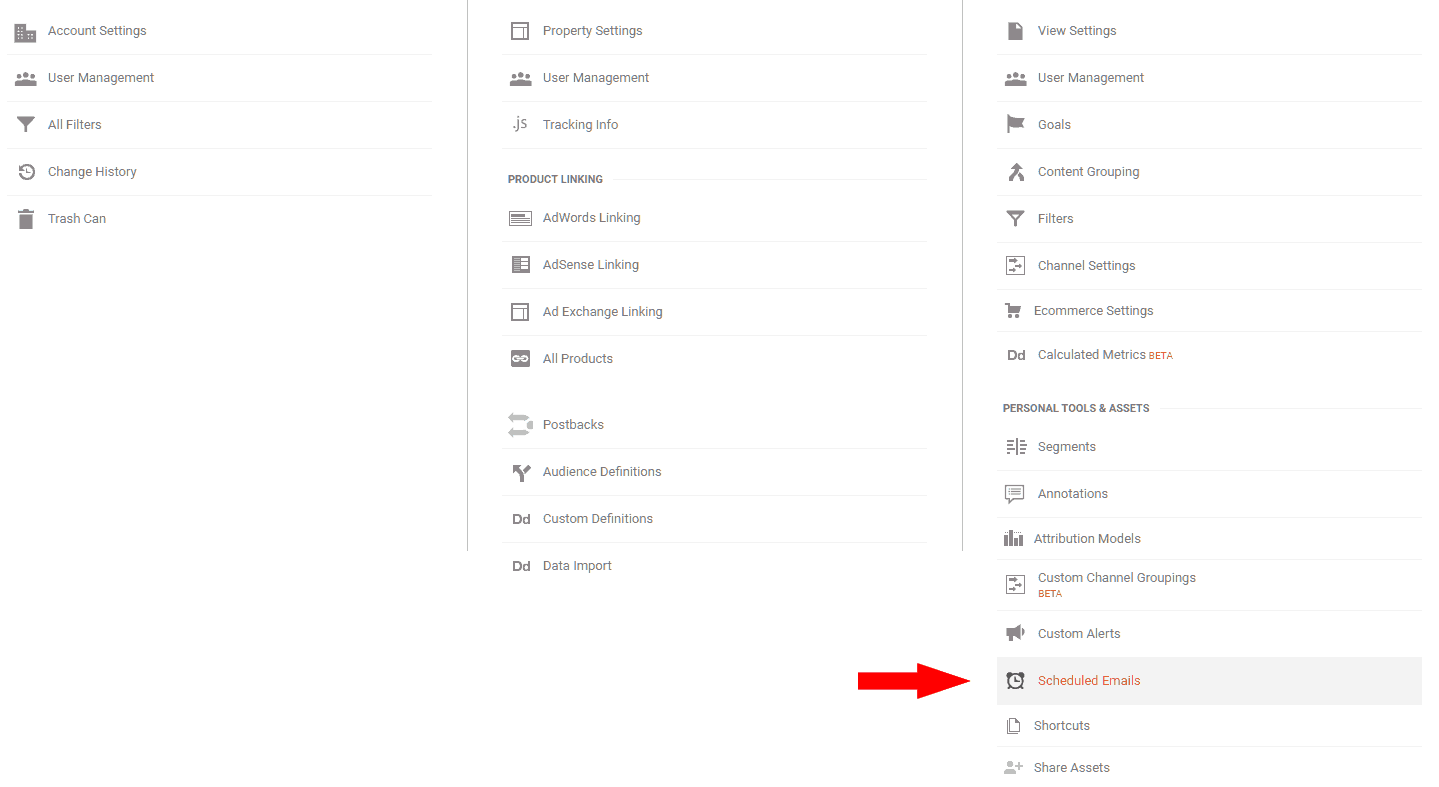
If you want to edit an existing email reporting setup, you can access it in your Admin panel -> View column -> Personal Tools & Assets -> Scheduled Emails.
Tracking custom video ads
Custom video ads is a Pro feature that allows you to serve any video as an ad, both in pre-roll and post-roll (read more in the guide Video Advertising Options with FV Player). You can see detailed data of your ads in Behavior -> Events -> Top Events. Here you can switch the primary dimension to Event Label and search for a phrase “Video Ad“. This will show you the names of all your video ads.
Click on the ad you want to analyze and you will access all the performance data, along with information about the errors. You can see the list of possible events in this table:
Custom Video Ad Events
| Video Ad Start | Number of started custom video ads. |
| Video Ad Skip | Number of times an ad was skipped by a user. |
| Video Ad first quartile | The ad has reached the first quartile of the playback. |
| Video Ad second quartile | The ad has reached the second quartile of the playback. |
| Video Ad third quartile | The ad has reached the third quartile of the playback. |
| Video Ad complete | The ad has finished it’s playback. |
| Video Ad Click | Number of times users clicked on the ad. |
| Video Ad error | Number of times an ad has failed in some way. |
Note: If you are serving your VAST/VPAID ads with your videos, you can track them in a similar way. Check our guide Tracking VAST and VPAID Ads With Google Analytics.
I LOVE YOUR PLAYER!
Thanks Artur! Wait until you see the new posting and video management interface.