List of contents:
- Introduction
- Integrating Matomo with FV Player
- Accessing the Statistical Data
- Accessing the Statistical Data Via Media Analytics
- Analyzing the data
Introduction
Analyzing how your content is doing and adjusting your content strategy accordingly, is the key to making your site better. Google Analytics is so widely used that it had become nearly synonymous to analyzing website data. Yet, there are some strong contenders out there. One of them is Matomo.
Matomo is a free open-source analytics tool. Thanks to its privacy policy and data protection, Matomo gained its popularity as a great alternative to Google Analytics. Matomo claims to give you full ownership and protection of the tracked data, as opposed to the way Google Analytics treats the tracked data.
The aim of this tool is to give you a more ethical alternative, helping you make sure that your website is GDPR compliant.
To get Matomo, you can either host it on your own server for free or use Matomo’s paid cloud service. While hosting it on the cloud is much easier, hosting it on your own gives you true control over your data, which is great for data sensitive businesses. You can see all the differences here.
Integrating Matomo with FV Player
After setting up your Matomo domain, you will see a welcome screen with installation guides and JavaScript tracking code to include on your site. In the installation guides part, you will see your Matomo URL and Site ID
If you already do have Matomo tracking, you can see the IDs of your sites by going to Settings -> Websites -> Manage in your Matomo dashboard.

Managing sites in Matomo
Inside of your WodPress Admin panel, navigate to Settings -> FV Player -> Setup tab -> Sitewide Flowplayer Defaults and paste the information into the Matomo/Piwik Tracking fields. Click Save All Changes.

Adding Matomo tracking to FV Player
Accessing the Statistical Data
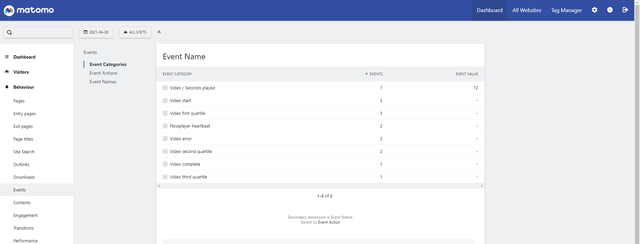
To access the data from FV Player, go to Dashboard -> Behaviour -> Events. Once there, you will see the following events:
Video start tells you how many times the video was started. Video complete tells you how many times the video got watched till the end. For everything in-between, there are the seconds played and quartile metrics.
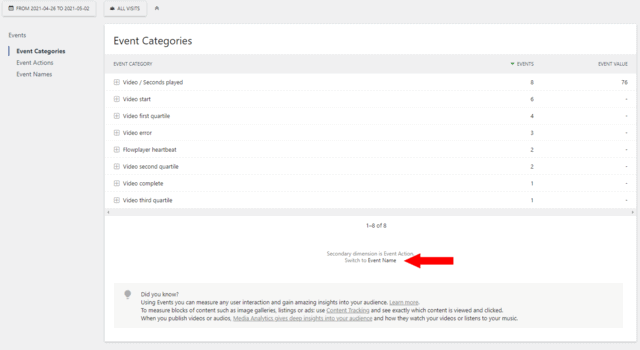
By default, the view in Event Categories, showing all the metrics, will have a secondary dimension of Event Actions. This view shows you data for separate video types.
In order to see data for individual videos names, you have to switch the secondary dimension to Event name.
Video seconds played
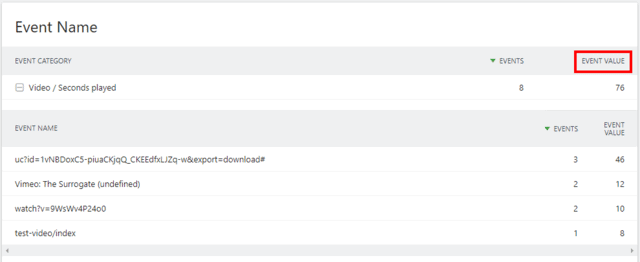
Video/Seconds played shows you the total number of seconds played in a particular video as an event value.

Event value of total seconds played
Video quartiles
Video quartiles help you see, how much of the video actually gets played. The fourth quartile is video complete. This helps you to see at which part of the video are your users prone to loose interest.
Video errors
You also get to track video errors which helps you search for faulty videos on your site and solve the issues. By further analysis of visitor logs, you also get to see on what devices or operating systems do the errors occur on.
Accessing the Statistical Data Via Media Analytics
FV Player also supports the Matomo Media Analytics plugin. If you own the paid Matomo Media Analytics Plugin, you will find the FV Player Analytics there automatically. You can learn more about how to use media analytics here.
Analyzing the data
Of course, Matomo allows you to see other standard analytics data. Most of these are easily accessible via the main menu.
For example, you get to access all the data regarding your visitors, such as their location and time, or devices and software used in the visitors tab. You can see how the visitors behave on your site, such as what do they click and many more via the behaviour tab.
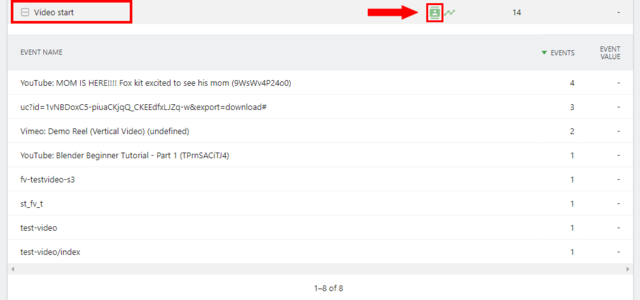
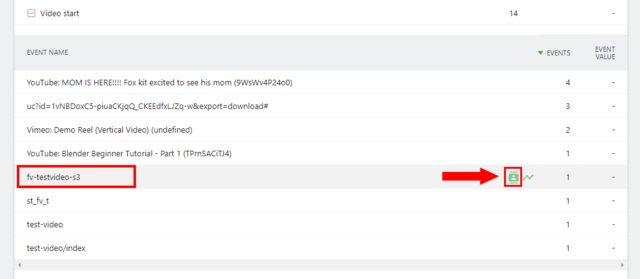
You can also access all of the data from visitor and behaviour tabs by opening the visit log connected to FV player video metrics, by clicking Open segmented visit log while hovering over the item.
These can be viewed regarding the primary dimension, for example event category – showing all the visitors that triggered the event on any video:

Opening visitor log for event
Or for the secondary dimension, in this example particular video – showing all the visitors that triggered the event on that video:

Opening visitor logs for a video
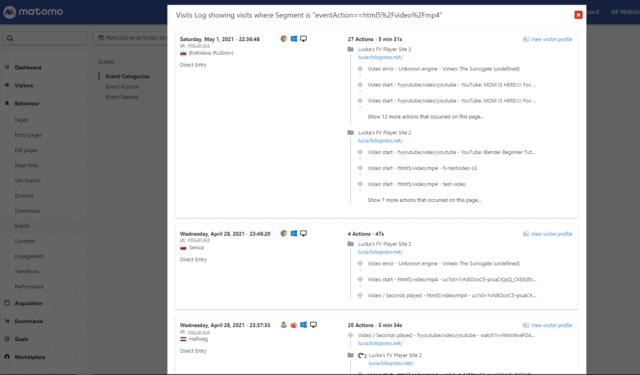
After opening the logs, you get to see cards for individual visits.
On the left side of the log, there is the date of the visit, the visitor’s IP, browser, operating system, device, location, how they entered the website and if they are a returning visitor.
On the right side of the log, you get to see all the actions the visitor took during their visit and the length of the visit.

Visit log for the event category of video start
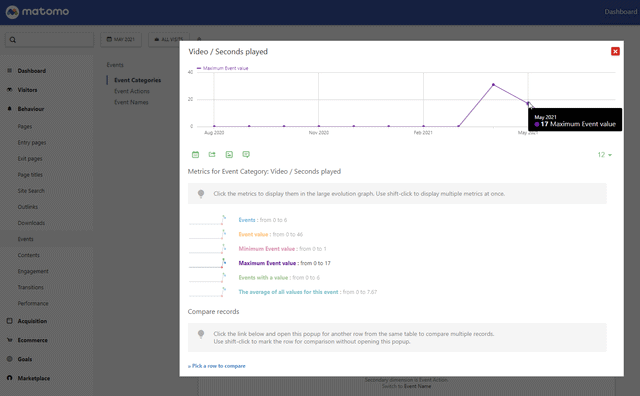
By clicking Open Row Evolution, you get the graph view. Here you can analyze your data over time. You can switch between various event value graphs and change the analyzed time window.
On top of the standard features and metrics shown in this guide, you can get many additional plugins to help you analyze your video data better on Matomo’s official marketplace.


