List of contents:
- Introduction
- Implementing the Tracking Code to FV Player
- Getting right video names
- Accessing the Statistical Data
- Creating Custom Reports
Introduction
Google Analytics is a great, free tool for tracking the performance of your website. It’s also a very useful platform for tracking the data about your videos.
After 8 years of the Universal Analytics model, Google released a new model, called Google Analytics 4 in October of 2020. We too had to rework our custom data gathering, in order to bring our users a reliable and great way to view FV Player statistics in the new Google Analytics model.
You can see how many times a video was played, how many seconds of the video a user watched, or where they left off watching. In addition to that, you can get the most out of it and see details such as the user’s platform, format or location and other data necessary to adjust the videos for your audience.
This guide assumes that you already have:
- Google Analytics account
- Basic knowledge of using Google Analytics
Implementing the Tracking Code to FV Player
In your Google Analytics account, go to Admin -> Data Streams and click on your data stream. There you will see the Measurement ID.

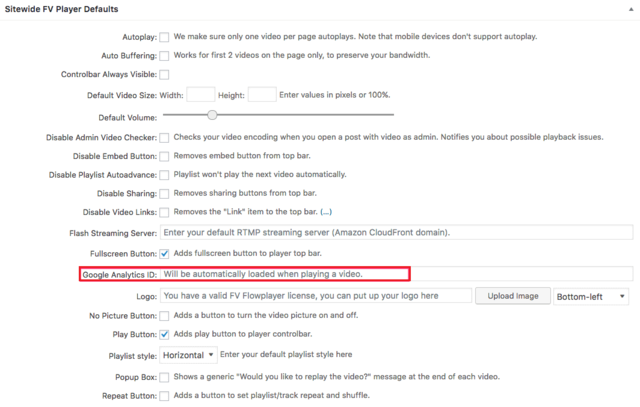
In your WordPress menu, go to wp-admin -> FV Player -> Settings -> Sitewide FV Player Defaults -> Google Analytics ID. Insert the Measurement ID and click save.
You probably already have the Global Site Tag gtag.js on your site. If you don’t, there’s no need to worry, as FV Player tracking does not need it to function.
Getting right video names
Unlike the old Google Analytics the new Google Analytics 4 does not show the event labels by default. Because of that it’s not easy to see the video plays for each video. You need to define your own custom dimensions to see the actual video names. Here’s how it’s done:
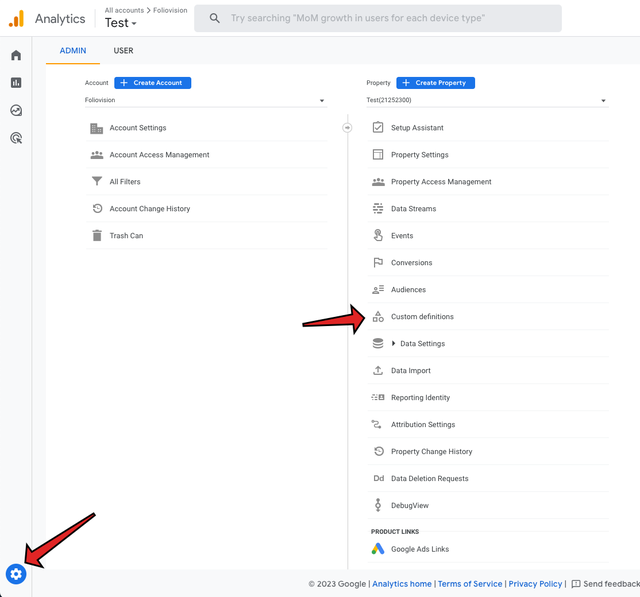
- Go to Admin -> Custom Definitions in your Google Analytics 4 property.
- Click “Create custom dimension”, fill in the details and click “Save”:
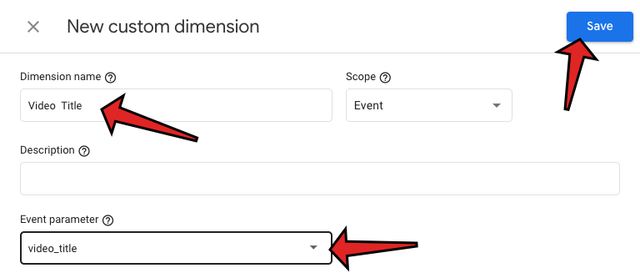
The “Event paremeter” should be video_title.
Please note that you will not be able to access historical data as Google Analytics 4 will only start processing the Video Titles once the custom dimension is added.
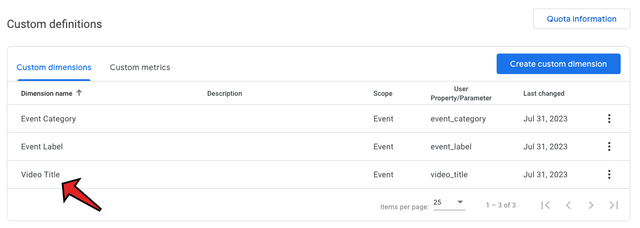
- This is how your new custom dimension should look like in the overview:
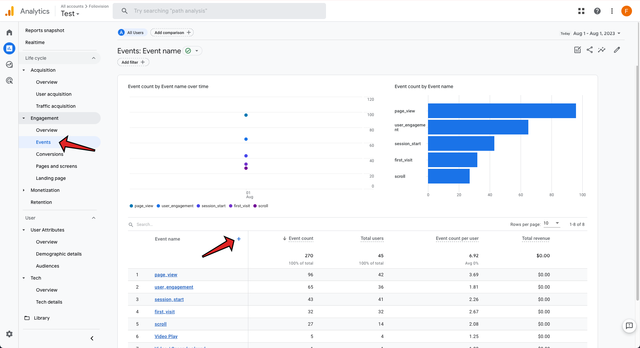
- Now go to Reports -> Engagement -> Events and click the plus icon next to “Event name”. We add our new custom dimension into that table that way:
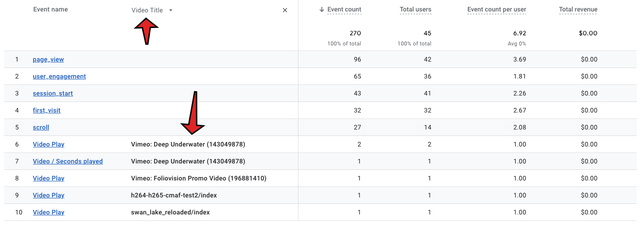
- Once the Video title is added you can see the Video Play and other events for each video:
Accessing the Statistical Data
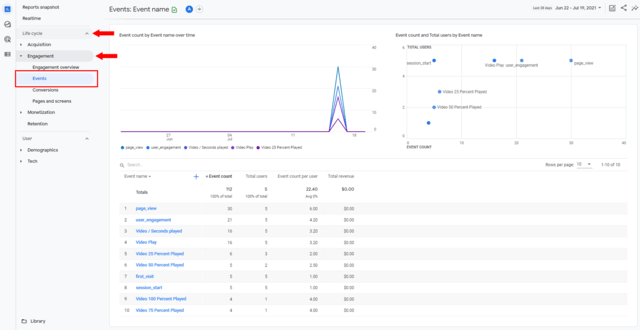
FV Player tracks video playback via custom events. These can be found in Life Cycle -> Engagement -> Events. You can also access it via engagement overview.
Video play and percentages
The video play metric tracks the number of plays.
After the tracking is triggered by a user playing the video, the next milestones marking the progress in a video are:
- Video 25 Percent Played
- Video 50 Percent Played
- Video 75 Percent Played
- Video 100 Percent Played
Video Seconds Played
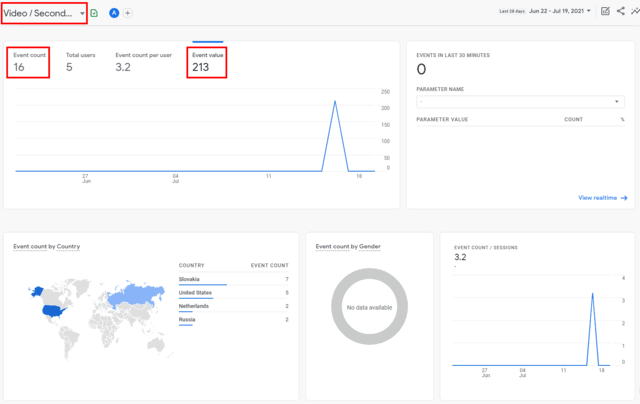
While all the other FV Player metrics have the same Event count and Event value, Video Seconds Played is slightly different.
Event count shows the number of videos in which the seconds of playback were counted. Event value shows the total number of seconds counted in all videos together.
Video events on individual posts
You can see how many times a video event was triggered on a particular post by going to Life cycle -> Engagement -> Pages and screens. Then, in the Event count, pick the desired event from the drop-down menu:

Device and Demographic data
You might want to see how many times an event occurs on a certain type of device or in a certain country. You can do this by setting the secondary dimension in the overview by clicking the plus button next to Event name dimension.
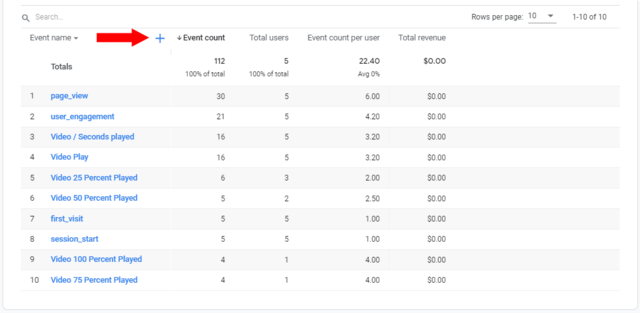
You can pick various dimensions showing information about the user, their device, mode of acquisition, and more. In this view, you get to see a count of each event for each type of item from the second dimension. Below is the view for browser:
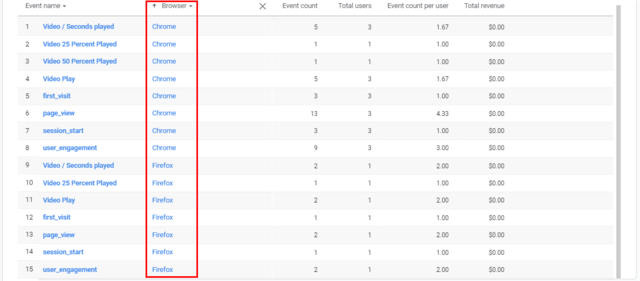
Another way to view data on demographics and technology, is to go to either Demographics -> Demographic details or Tech -> Tech details. There, pick the demographical or technical information you are interested in viewing and then in Event count set the desired event. The Video play event for Browser type is pictured below:
Creating Custom Reports
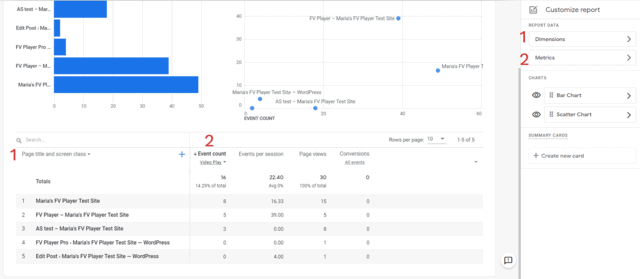
Custom reports allow you to keep an close eye on any parameters of your choosing.The report in this example focuses on video play event by page. Various other metrics let you compare and further analyze the data. For example, the page views metric lets you see how many of page/ post viewers did actually start the video.
In the left hand menu, go to Library. Once there, click Create new report. You get to choose to either go according to a template, or start with a blank report.

First add the primary dimension. You can add any number of dimensions and then switch between them. Once you picked the dimensions, click apply. In this example, the primary dimension is Page title and screen class. Then Add the metrics. Again, you can add any number of these. In this example, the metrics are Event Count (set to Video play event), Page view, Events per session and Conversions. Don’t forge t to click apply before existing. You can also pick the chart types.
