Unicorn is no longer a white horse with a narwhal like tusk. Still rare, “unicorn” since 2013 refers to a privately held company with a market valuation of over $1 billion.
Most often the “valuation” is fuelled more by potential and VC greed than by existing revenue. But there’s more and more of them every year. The graph below shows the number of startups who reached the unicorn status each year (2016 – 2021).
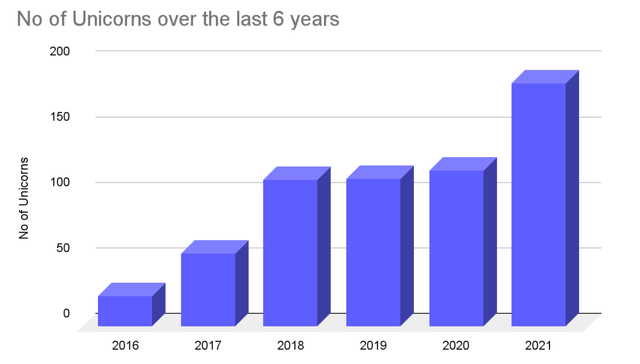 source: eqvista
We set ourselves the task to try to figure out how many of these mythical creatures grow up to become viable businesses in both North America and Europe.
How do they estimate a company’s valuation?
It would be an understatement to say that the methodology used for the calculation of the companies’ value is a complex and difficult process. There are several ways of estimating the market valuation of unicorns, but the reason for recent exaggerated digits might be the overall paradigm shift in attitude.
Historically, valuations have been calculated as a 7x to 10x multiple of a company’s profit. Nowadays, because of the fast-growing, VC-backed market, reaching profitability is not an issue anymore. To ensure the capital injections leading to large valuations, startup founders seek to persuade venture capitalists that their startup can both be profitable and, even more importantly, will be able to take over an important market. More and more often, startups reach significant market valuation in relatively early-stage funding rounds.
How do professionals evaluate the potential startups via numerical model? There’s several methods.
The Times-Revenue method
This is relatively simple method of determining the value of a startup and relies on multiplying its revenue. The multiplier is usually set between 5x and 10x and depends on several factors such as macroeconomic environment, business model, and track record of the management team. However, Hannah Skingle criticises this method in her article, for its implicit presumption that revenue and profitability are linked.
Net Present Value method
This method relies on the company’s estimation of future cashflow. So, the calculation is based on subtracting the upfront capital needed to start the company from the total value of the company’s estimated future cashflow. Joe Knight, a co-founder and owner of www.business-literacy.com explains the method as follows:
Net present value is the present value of the cash flows at the required rate of return of your project compared to your initial investment.
Here is the basic formula for calculating the NPV of a company, although it’s almost never calculated by hand. Even Excel has a NPV calculating function.
 source: hbr.org
The difficult with this method is that its based on predicting future revenue, i.e. guessing.
The VC method
This method represents the most common VC valuation approach and was developed in 1987 by early VC Bill Sahlman. Basically, the estimated future exit value of the venture is divided by the return on investment that an investor is seeking. Then this figure is subtracted by the post-money valuation – the total amount of capital invested in the company – to give the pre-money valuation.
In practice it consists of six following steps:
- Estimate the Investment Needed
- Forecast Startup Financials
- Determine the Timing of Exit (IPO, M&A, etc.)
- Calculate Multiple at Exit (based on comps)
- Discount to Present Value at the Desired Rate of Return
- Determine Valuation and Desired Ownership Stake
Since every method at some point is based on guesswork and often too optimistic expectations, it’s no surprise that a huge proportion of VC-fuelled unicorn startups end up as either unprofitable on larger revenues or never even achieve revenue to justify their valuation.
The future? Hopes for an IPO or buyout
As implied, the reason behind drastically overhauled valuation of some unicorns stems from the VC mindset, happy to kill a company via acquisition. Many multinationals will buy out a unicorn when they find one wandering in their market forests, just to prevent future competition.
Many billionaires have been created by Adobe, Facebook, Microsoft, Google, Oracle and others buying out competitors before they get too far past the starting line.
Still, going public remains a more popular form of exit than acquisition. Following graph shows the number of unicorn exits worldwide from 2006 to July 2021 by exit type.
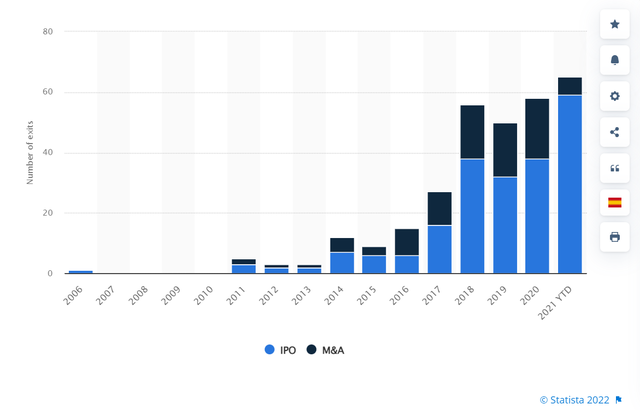 source: statista
Famously, Mark Zuckerburg refused many initial courtiers of Facebook, refusing to sell at multi-billion dollar valuations while still living in debt and with no source of immediate revenue or personal income.
Still, in case of IPOs the potential of success isn’t always bright either. Crunchbase News came up with following table comparing company valuation, revenues, and losses, concluding that if all the included unicorns were put together, they would make one enormous, money-losing super-unicorn.
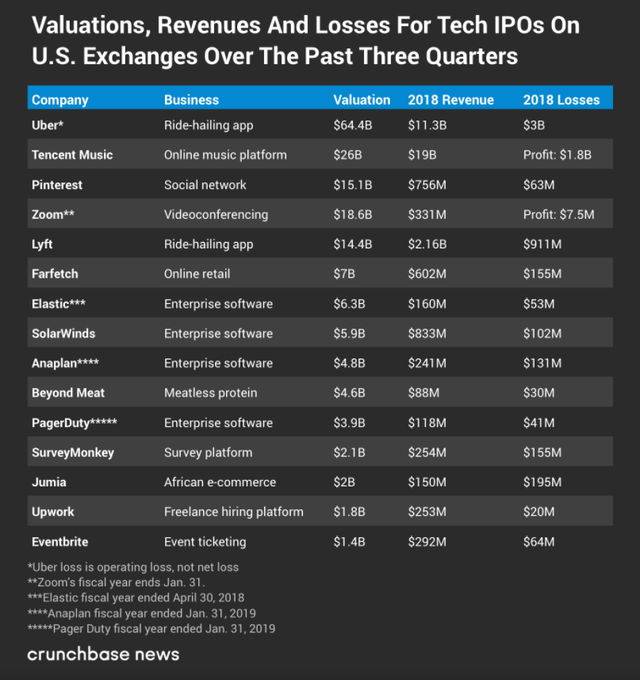 source: crunchbase
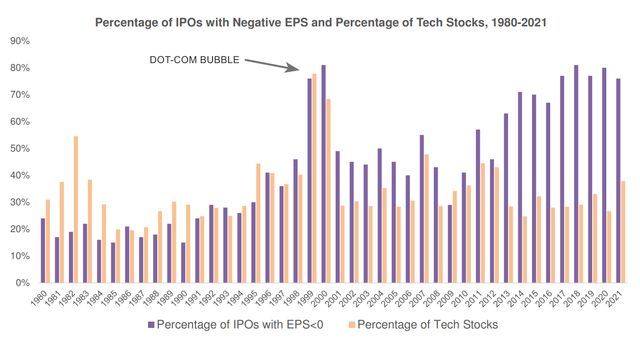
After all, according to Keith Wright, recent situation resembles the dot-com bubble, arguing that while 81% of the IPOs in 2000 were of unprofitable companies, out of 160 IPOs in 2017, at the time of the IPO 76% of these companies had failed to ever turn a profit. More recently, after seeing numbers of last 100 IPOs of 2022, one can easily see that the returns are more often than not in the red. Furthermore, here you can see US stock market IPOs of last 4 years (2019 – 2022). Once again, dominated mostly by red.
To clearly see how close to dot-com bubble we are right now, professor Jay R. Ritter offers meticulous and up-to-date data on fraction of IPOs with negative earnings per share (EPS), from 1980 to 2021. The data include trailing last twelve months earnings. Trailing EPS benefits from using actual numbers instead of projections. since it relies on previous four quarters of earnings in its calculation.
source: Jay R. Ritter – Initial Public Offerings: Updated Statistics (2022)
So how much are unicorns overhauled?
Reading this far, one can see that valuation of the startup is not necessarily linked to its profitability and market valuations are exaggerated. Just how much? Stanford researchers Ilya Strebulaev and Will Gornall invented a valuation model in their study called Squaring venture capital valuations with reality, which aims at fair valuation expected at the exit.
Our model is designed to produce fair value estimates that are better proxies for expected value at exit
On the average, examined unicorns are about 51% above what they are really worth, and out of 135 companies, 65 lost their unicorn status when researchers applied their valuation model. The range of overvaluation also provides unflattering insight:
We apply our model to a sample of 135 US unicorns and find that post–money valuations overstate company values in all cases, with the degree of overvaluation ranging from 5% to a staggering 188%, “scientists reported, adding that,” While the ten least overvalued companies are overvalued on average only by 13%, the ten most overvalued companies are on average overvalued by 145%.
Following up on their study, Strebulaev and Gornall came up with the startup stock option calculator and public company stock option calculator, which apply the findings from their study in practice. The goal is to offer potential shareholders a more realistic view on how much their share is really worth. Both calculators are featured on the domain valuation.vc. However, the software is still in beta version and further updates are yet to come.
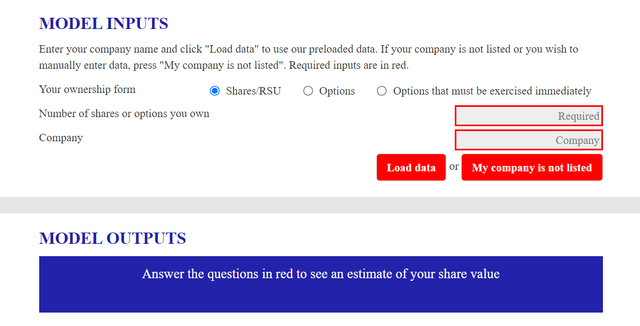 source: valuation.cv
Here’s a look at the top overvalued unicorns from Strebulaev and Gornall’s study of 135.
| Company | Valuation | Fair Valuation | Difference |
| Datto | $1B | $300M | 205% |
| Better Place | $2.3B | $800M | 196% |
| Box | $2.6B | $900M | 195% |
| Demand Media | $1.2B | $400M | 188% |
| SolarCity | $1.9B | $600M | 188% |
| Square | $6B | $2.2B | 171% |
| Nutanix | $2B | $800M | 156% |
| Good Technology | $1.2B | $500M | 155% |
| Kabbage | $1B | $400M | 138% |
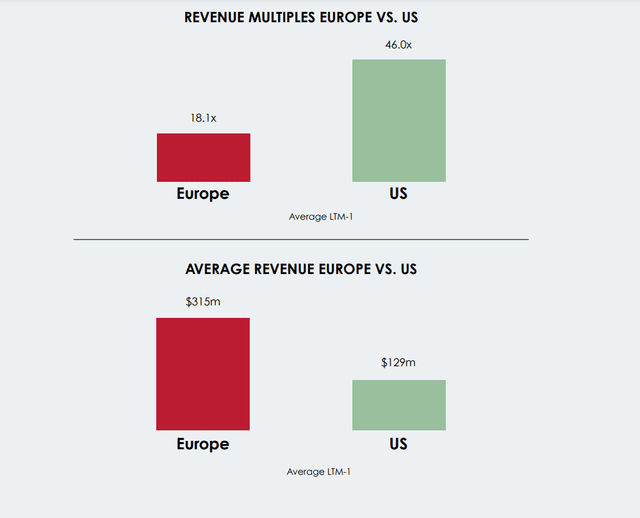
Cleary the market valuation of US unicorns is hugely bloated. Is the situation any better in Europe? Another study conducted by GP Bullhound, albeit slightly outdated, offers insight into European startups in 2016 and before. Results suggest that average European unicorns have significantly lower valuations than their US counterparts, particularly when comparing revenue. I.e. to achieve a billion dollar valuation, a European startup must show much higher existing revenue. Bullhound ascribe this result to the more conservative decision-making of European investors when evaluating startups (or new businesses in general).
Conducting my own revenue research, I can prove that successful EU startups appeared to be more transparent than their American counterparts who are prone to raising additional funds by bragging about their existing (inflated) valuation.
These are the clear results:

source: GP Bullhound
Unicorn comparison: Valuation vs. revenue – our findings
Following tables compare market value of selected US and European unicorns who joined the one billion club in 2020, taken from the CBInsights database. It turns out only a small percentage of the unicorns is profitable. Precisely, only 6 out of 73, which represents only 8% (as of 2020).
If a startup unicorn hasn’t yet gone to IPO (legal obligation to disclose their revenue in the pre-IPO report or later, post-IPO, in the public annual report), it’s difficult to get accurate revenue numbers. No surprise, since everything suggests that most unicorns – especially those born in Silicon Valley – are giant rainbow-speckled soap bubbles.
To offer at least approximate glimpse into the unicorns’ revenue we used estimated revenues from Zoominfo. This is a significant compromise, since most of the Zooominfo estimated numbers do not match real revenue (where both exist). Most of the time Zoominfo overestimates revenue. Alternatives such as Growjo, Incfact or Craft.co data was even less accurate. Even highly priced platforms such as CBinsights and Crunchbase don’t offer revenue estimates for most of the companies in their databases.
One must hope that Zoominfo’s database of European companies will be equally inaccurate as their US-database.
This table shows the list of US-based unicorns who joined the club in 2020:
| Company | Valuation in billion | Estimate revenue | Ratio | Occupation |
| GoPuff | $15 | $3 Billion | 5x | E-commerce & direct-to-consumer |
| Figma | $10 | $227 Million | 44x | Internet software & services |
| Notion Labs | $10 | $8 Million | 1 250x | Internet software & services |
| Thrasio | $10 | $1 Billion | 10x | Other |
| Klaviyo | $9.2 | $105 Million | 87x | Internet software & services |
| Synk | $8.6 | $5 Million | 172x | Cybersecurity |
| Tipalti | $8.3 | $147 Million | 56x | Fintech |
| Gong | $7.25 | $100 Million | 72.5x | Artificial intelligence |
| Ro | $7 | $84 Million | 83x | Health |
| Rippling | $6.5 | $110 Million | 59x | Internet software & services |
| Better.com | $6 | $2 Billion | 3x | Fintech |
| Attentive | $5.99 | $340 Million | 17.6x | Mobile & telecommunications |
| Cityblock Health | $5.7 | $467 Million | 17x | Health |
| Postman | $5.6 | $61 Million | 91x | Internet software & services |
| FiveTran | $5.6 | $89 Million | 62x | Data management & analytics |
| Lyra Health | $5.85 | $280 Million | 20.9x | Health |
| Arctic Wolf Networks | $4.3 | $210 Million | 20.5x | Cybersecurity |
| Relativity Space | $4.2 | $51 Million | 82x | Other |
| Patreon | $4 | $42 Million | 95x | Internet software & service |
| Olive | $4 | $210 Million | 19x | Internet software & services |
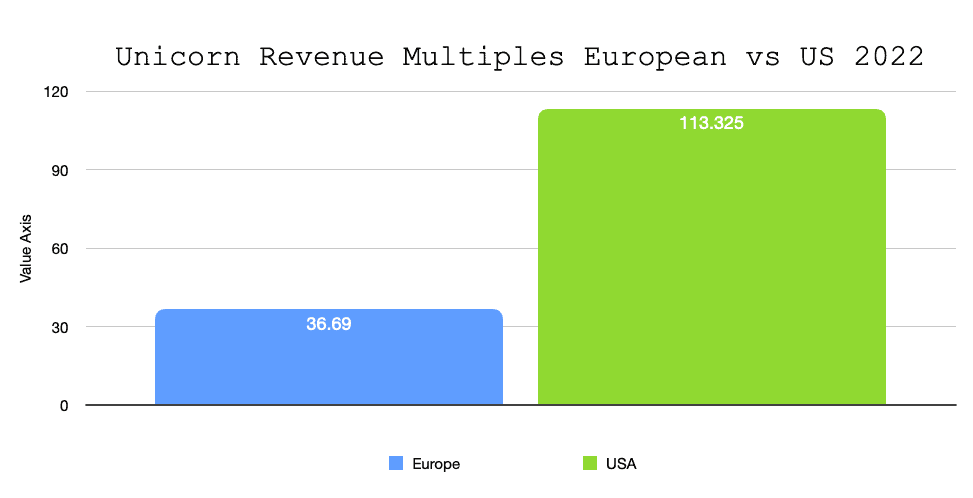
After dividing the valuation of each American company on this list by the estimate revenue drafted from the Zoominfo database, we can see that on average the valuation is 113.325 times bigger than the actual revenue.
Here you can see the overview of European startups who reached the unicorn status in 2020:
| Company | Valuation in billion |
Estimate revenue | Ratio | Occupation |
| Hopin | $7.75 | $70 Million | 110x | Internet software & services |
| Figma | $10 | $227 Million | 44x | Internet software & services |
| Mollie | $6.5 | $154 Million | 42x | Fintech |
| Howden Group Holdings | $5 | $114 Million | 43.9x | Other |
| MessageBird | $3.8 | $84 Million | 45x | Mobile & telecommunications |
| Mirakl | $3.5 | $243 Million | 14x | E-commerce & direct-to-consumer |
| Voodoo | $2.31 | $11 Million | 210x | Fintech |
| Gymshark | $1.45 | $270 Million | 5.4x | E-commerce & direct-to-consumer |
| Workhuman | $1.2 | $142 Million | 8.5x | Internet software & services |
| Hotmart | $1 | $168 Million | 5.9x | E-commerce & direct-to-consumer |
| Infobip | $1 | $630 Million | 1.6x | Mobile & telecommunications |
| Gousto | $1.7 | $210 Million | 8x | Supply chain, logistics, & delivery |
| Cazoo | $1 | 503 Million | 1.9x | E-commerce |
| Oatly | $2 | $584 Million | 3.4x | Consumer & retail |
| Arrival | $3.92 | $583 Million | 6.7x | Auto |
Once again, after dividing the valuation of each European company on this list by the estimate revenue drafted from the Zoominfo database, we can see that on average, the valuation is 36.69 times bigger than the actual revenue. The three times lower valuation ratio leaves a lot more upside for a late-arriving investor.
Based on the valuations above for US-based startups, it appears that Keith Wright is on to something. The current IPO bubble resembles that of the original Dot.com bubble. Some of these companies will have long and viable business lives, but probably nowhere near the value ratio at which they currently trade.
Overvalued technology IPO’s are something about which Softbank and Masayoshi Son could tell investors in great depth. In the face of the next great unicorn IPO, proceed with extreme caution.
Leave a Reply